
Type 2 Diabetes and obesity are often found together, and it is exceedingly complex to disentangle the cause and the effect. Identifying individuals at risk so that preventative measures might be discussed, initiated, and perhaps even followed has been complicated by medicine’s pesky insistence on evidence-based care, making screening costly in dollars and time.
While diagnostic testing is often limited to an abnormal hemoglobin A1c, fasting blood (plasma, more specifically) glucose remains a less expensive and more frequently performed test. The siren calls of cheap and easy prompted researchers to develop an algorithm to predict the risk of the onset of diabetes over 10 years simply using fasting plasma glucose (FPG). A diagnosis of diabetes was based on two separate FPGs of 126mg/dL. The data set comes from the Rochester Epidemiology Project (REP), a long-term prospective data set of Olmsted County, Minnesota residents. [1]
The study involved 45,000 individuals aged 18 to 65 years (mean 43.7), slightly more women than men, and reflective of Olmsted’s population. The REP population's sex and racial/ethnic characteristics are similar to those of Minnesota and the Upper Midwest. Age- and sex-specific mortality rates are similar to those of the entire US, but the population is less racially and ethnically diverse and more highly educated than the overall US population. The mean BMI was 28.9, slightly less than the national average of 29.2.
Over a median follow-up of 6.8 years, 3,879 individuals (8.6%) developed diabetes with a 10-year cumulative risk of the onset of diabetes of 12.8%
- Men had a 31 % higher risk of developing diabetes compared to women [2]
- Age ≥60 years was associated with a 97% increased risk of diabetes.
- Any abnormal BMI category was associated with increased risk compared to a reference BMI of 18.5 to 24.93. A BMI less than 18.5 had a 143% increased risk, while a BMI of ≥40 increased that risk three-fold
- All initial FPG levels outside the range of 80 to 94 mg/dL were associated with an increased risk of diabetes. An FPG level less than 70 mg/dL had an increased risk of 250%, while an FPG between 120-125 mg/dL had an eleven-fold increase.
The researchers constructed models showing the 10-year risk of diabetes as a function of age, sex, BMI, and initial FPG.
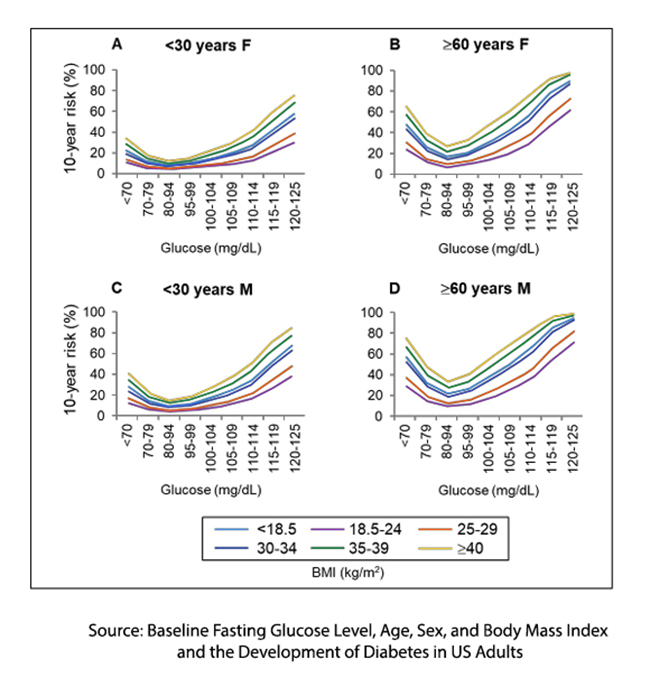
This figure taken from the supplemental information shows those findings. There is clear visual evidence of a more significant risk with age and gender. There is also visual evidence that an increasing BMI over “normal” increases the risk of diabetes. But the critical point, at least for this discussion, is that there is a greater risk of diabetes with “too-low” a BMI or FPG. The lowest risk is at the bottom of a U-shaped curve, reminiscent of Nike’s swoosh.
This is their nomogram.

Just being a male aged 60 or more puts you at increasing risk, as does a BMI of 35 or more, irrespective of gender.
It seems that diabetes results from an abnormal glucose metabolism that impacts both the highs and the lows. Focusing on just one end of the spectrum belies the reality of biological phenomena that is more often the swope than an upwards or downwards line.
As the authors note, this finding is
“…biologically plausible, as there is a known curvilinear association between many biological parameters (including glucose) and health outcomes.”
The study comes with the usual strengths and limitations. It is a large cohort with little missing data and few variables – all strengths. It is observational, looking at one US county that is not overly diverse and biased by measuring individuals seeking medical evaluation – all weaknesses.
The study highlights the tension between “reductive” and “holistic” approaches to a significant healthcare burden. The use of FPG exemplifies the reductionist mindset, prioritizing a single discrete measure that is cost-effective and accessible to identify risk. But in the past, that mindset relied on the assumption that the risk was linear, increasing with every increase in FPG. This study shows that the assumption of a linear relationship is incorrect - oversimplifying diabetes metabolic complexity. While FPG may most readily identify risk, recognizing the roles of diet, cultural norms, physical activity, and stress are necessary for holistic care. Simple metrics like FPG can be helpful, but they don’t tell the whole story. While the new predictive algorithm offers a cost-effective way to estimate diabetes risk, it also exposes the flaws of a reductive approach that assumes risk follows a straight-line progression. Reality is more complex.
[1] The sharp-eyed reader will note that this is the ancestral home and headquarters of the Mayo Clinic.
[2] In the article, these risks were quantified as hazard ratios.
Source: Baseline Fasting Glucose Level, Age, Sex, and Body Mass Index and the Development of Diabetes in US Adults JAMA Network Open DOI: 10.1001/jamanetworkopen.2024.56067

Chuck Dinerstein, MD, MBA
Director of Medicine
Dr. Charles Dinerstein, M.D., MBA, FACS is Director of Medicine at the American Council on Science and Health. He has over 25 years of experience as a vascular surgeon.